Latest filing processed Oct 15, 2026
Normalized fundamentals, traced to the filing
975 US corporates across 9 sectors on one comparable schema, every derived ratio with its formula showing. Banks run on their own prudential framework — 8 covered today, 106 more across 17 markets in the pipeline.
975 US corporates
9 sectors · up to 10 years, annual and quarterly
8 banks · 106 in the pipeline
On a prudential framework · 17 markets next
Every figure traced to its filing
The source disclosure is one click away
Every ratio shows its formula
Inputs named, nothing hidden in a black box
Live in your Excel models
Formulas that refresh when new filings land
Two frameworks
A bank is not a corporate
They report differently, are regulated differently and answer different questions. So each is analysed on its own framework, in the same platform.
The full prudential stack
Banks are read on capital, liquidity and funding, normalized across jurisdictions — not a corporate template with a few ratios swapped out.
- Capital
- CET1Tier 1Leverage
- Liquidity
- LCRNSFR
- Funding & returns
- Funding mixNIMCost / incomeROE
- Credit
- Asset qualitySub-debt & AT1
Each bank's capital and liquidity sit beside its own jurisdiction's regulatory context. Next in the pipeline: Jordan, the United Arab Emirates, the United States and the Philippines and more.
Sector-native, never a generic model
Corporates are normalized onto one comparable schema, with the as-reported statements and segment data kept alongside.
- Statements
- Normalized IS / BS / CFAs-reportedSegments
- Performance
- EBITDAFree cash flowROIC
- Credit
- LeverageCoverageLiquidity
- Valuation
- DCF from filed inputsPeer benchmarking
Reported figures link to their 10-K; calculated ones show their formula and inputs.
Accurate & auditable
Every number, traceable to its source
Reported figures open the filing they came from, down to the line where the filing tags it. Calculated figures show their formula, with every input named and sourced.
Nvidia Corp's FY2026 10-K reports revenue 215,938, net income 120,067 and depreciation and amortisation 2,843 (USD mn). EBITDA is EBIT 130,387 plus depreciation and amortisation 2,843, which is 133,230. EBITDA margin is EBITDA divided by revenue: 61.7%, against 63.8% in FY2025.
1 · The filing
Form 10-K · Fiscal 2026
Nvidia Corp
Income statement · USD mn
Balance sheet
Cash flow statement
Segment information
2 · As reported
3 · Calculated
EBITDA margin
61.7%
= EBITDA 133,230 ÷ Revenue 215,938
EBITDA
133,230
= EBIT 130,387 (calc.) + D&A 2,843
As reported · Revenue
Calculated · EBITDA margin
Reading the filing…
Access
One dataset, wherever you work
The numbers in the platform, in your spreadsheet and in your systems are the same numbers, with the same sources behind them.
Live formulas in the models you already run
VITATI.VALUE and VITATI.SERIES pull figures into your cells and refresh when new filings land. Insert a full Stat Book in one click; every value links back to its SEC filing and stays a number your formulas can use.
Web platform
AvailableEvery module in the browser at app.vitati360.com — company pages, peers, screener, risk and valuation.
Open the platformData API
AvailableThe same normalized, sourced data, delivered straight into your own systems and models.
Request API accessMCP server
Coming soonConnect your AI assistant to the same sourced data. In development — ask to be told when it opens.
Notify meInside the platform
Look inside any module
Select one to see the question it answers and what sits inside it.
Banks & corporates
Banks only
Company Intelligence
What does this company actually look like?
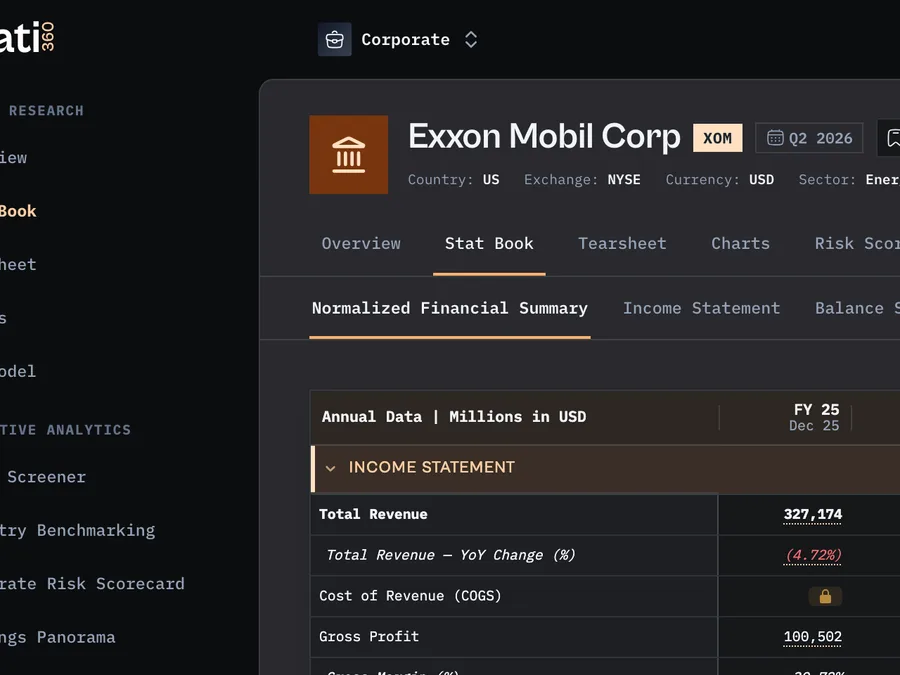
Open any company and you land on the Stat Book — up to 10 years of annual and quarterly data, full income statement, balance sheet, cash flow and credit scorecard. Every derived ratio shows the formula and the inputs behind it, each traced to the disclosure it came from.
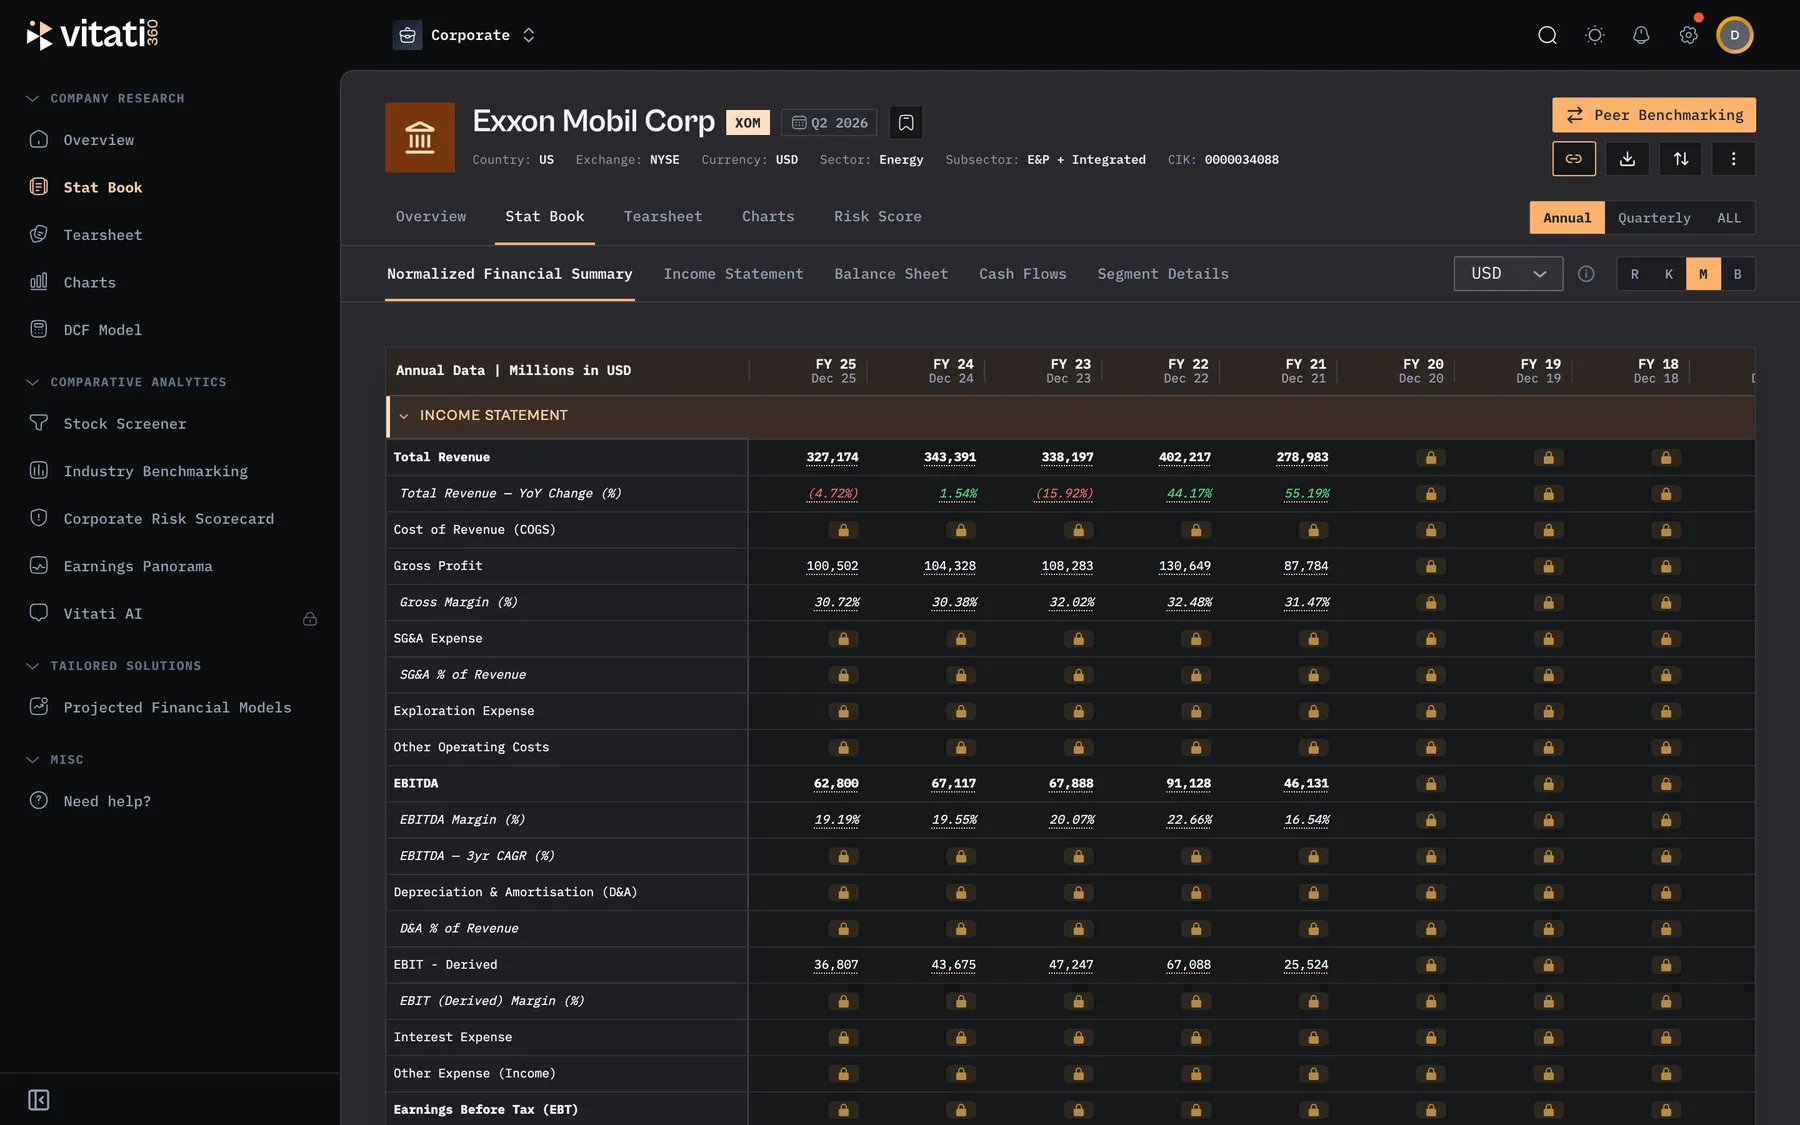
Work inside the platform, or pull the same numbers into your own Excel models with live formulas.
Open it in the live demoIs your company covered?
Search 983 companies, or browse a sector. Every company page shows its headline figures with their sources.
Data catalogue
Everything in one subscription
The data, the analysis around it and the tools that keep a coverage list current between reporting seasons.
Data & analysis
Excel add-in
Live VITATI formulas in the models you already run. They refresh when new filings land, and every value links to its SEC filing.
- VALUE · SERIES · PERIODS · SOURCE
- A full Stat Book in one click
- Peers side by side, one currency
Ratios with formulas
Every derived ratio opens its formula, with each input named and traced to its filing.
Financial statements
Income statement, balance sheet and cash flow as reported, annual and quarterly, with segment detail.
Normalized view
Non-recurring and non-operating items adjusted for comparability, as-reported alongside.
Bank prudential metrics
A framework built for banks, normalized across jurisdictions.
Peer benchmarking
Build a peer set and compare it on one schema, whatever each company reports.
Around the analysis
Watchlists
The names you cover in one list, each a click away.
Saved views & chart templates
Save a peer comparison or chart once, reapply it anywhere.
Recent events
Material events from 8-K filings, as they are filed.
Insider activity & holders
Form 4 transactions and 13G major holders beside the numbers.
Tearsheets
A one-page profile of any company, ready to share as a PDF.
Data checks
Figures checked against the filing; open checks flagged on the number.
The data itself
From the companies’ own filings
SEC EDGAR for US issuers; annual reports and regulatory disclosures elsewhere.
Restatements kept as filed
Reconstruct what was known at any point in time, not just the latest restated view.
In the platform within hours of filing
An automated watcher checks SEC EDGAR every hour and imports new 10-K and 10-Q filings from US filers as they land.
Who uses Vitati360
Institutions that run on fundamentals
Buy-side, treasury, risk, strategy and investor relations — all working from the same normalized, sourced dataset.
Buy-side & Asset Management
The peer dataset is current before results day. Screen, compare and monitor exposures across banks and corporates without rebuilding the comp set every reporting cycle.
Treasury & ALM
Comparable funding, liquidity and capital metrics across the counterparty universe — updated within days of filing, and consistent across institutions that report on entirely different bases.
Risk & Capital Management
A credit view that holds up in committee: capital, leverage, liquidity and asset quality across every name, benchmarked on one framework regardless of how each institution chose to report.
Strategy & Corporate Development
Sector and peer views built on a single standardised source — so the strategy session opens on a shared factual baseline, not four datasets that disagree about the same metric.
Investor Relations
Management walks into every analyst call, roadshow and shareholder meeting with the peer data already assembled — not rebuilt under time pressure the morning results drop.
No subscription needed
Buy exactly the report you need
Configure a custom report, or take a ready-made data compendium as an analysis-ready Excel workbook. Pay once; built on the same sourced data as the platform.
- 1
Pick a country
Choose the market you need.
- 2
Pick the companies
Hand-pick names, or take the full coverage.
- 3
Pick the deliverable
Stat Book, tearsheets, or the full chart pack — priced as you configure.
- Pay once — the price follows the scope you chose.
FAQ
Questions, answered
Anything not covered here? Write to us — every question gets a substantive reply within one business day.
[email protected]A financial analysis platform for institutional teams, covering 983 companies: 975 US corporates across 9 sectors and 8 banks. As-reported financials, normalized analysis and standard analytical workflows in one place — for banks and corporates, each through its own analytical structure. Work inside the platform, or pull the same numbers into your own Excel models with live formulas.
Get started
Try it on your own coverage
Explore company data and the screener free for 14 days. Every request gets a reply within one business day.